
Figure 2.
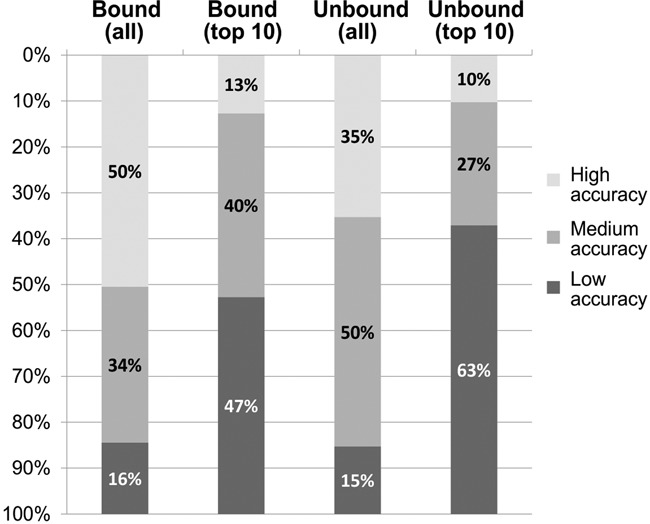
CABS-dock performance summary for 103 bound and 68 unbound benchmark cases. The percentages of high-, medium- or low-accuracy models (quality assessment criteria are given in the text) are reported for the best quality models found in the sets of 10 000 models (all) and in the sets of 10 final models (top 10). Detailed results, for each modeled complex and each prediction run, are available in Supplementary Tables S1 (bound docking cases) and S2 (unbound docking cases).