
Figure 2.
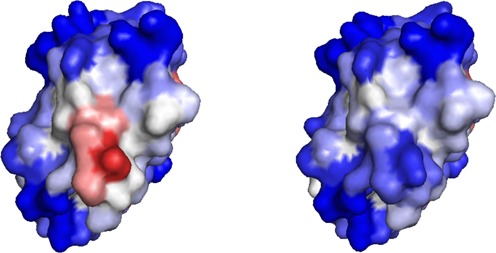
A3D analysis of the β-chains of deoxyhemoglobin S (PDB: 2HBS:D) (left) and deoxyhemoglobin A (right). Color code is as in Figure 1b. The detected aggregation-prone area in deoxyhemoglobin S includes Val6.
Official websites use .gov
A
.gov website belongs to an official
government organization in the United States.
Secure .gov websites use HTTPS
A lock (
) or https:// means you've safely
connected to the .gov website. Share sensitive
information only on official, secure websites.
A3D analysis of the β-chains of deoxyhemoglobin S (PDB: 2HBS:D) (left) and deoxyhemoglobin A (right). Color code is as in Figure 1b. The detected aggregation-prone area in deoxyhemoglobin S includes Val6.