
Figure 1.
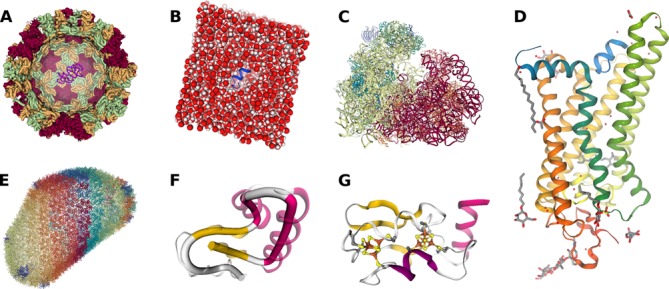
Gallery of molecular visualizations showing various representations of differently sized macromolecules. (A) Structure of the Noro virus capsid (PDB entry 1IHM) that forms the outer shell of the virus, colored by chainindex. The front of the capsid is clipped away and depicted inside the virus capsid is, for size comparison, the structure of a conserved retroviral RNA packaging element from the Moloney murine leukemia virus (PDB entry 2LIF). (B) System of a peptide derived from the C-terminus of ‘transducin’ (blue cartoon) surrounded by a box of water molecules (spacefill representation) in preparation for a molecular dynamics simulation. (C) Structure of a mammalian 80S ‘ribosome’ (PDB entry 4UJD) colored by chainindex. (D) Structure of light-activated ‘rhodopsin’ in complex with a peptide derived from the C-terminus of ‘transducin’ (PDB entry 3PQR), colored by residueindex. (E) HIV-1 capsid structure (PDB entry 3J3Y) showing the backbone colored by chainindex. (F) Example usage of the rope representation (solid tube) to display the protein fold in a more abstract way as compared to the cartoon representation (translucent). The structure shown is that of ‘crambin’ (PDB entry 1CRN) colored by secondary structure with magenta alpha-helices and yellow beta-strands. (G) The secondary structure of ‘ferredoxin’ (PDB entry 1BLU) and its two [4Fe–4S] clusters highlighted with the ‘HyperBall’ representation.