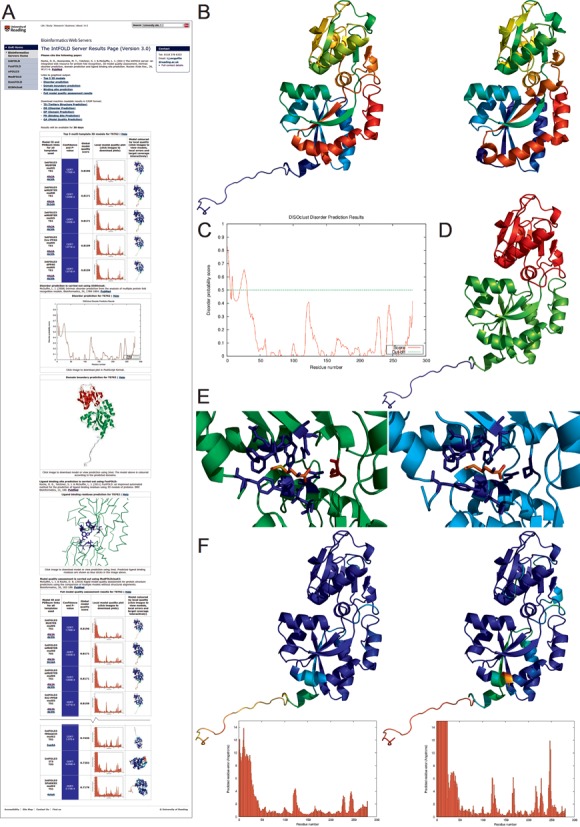
Figure 1.

IntFOLD server results for an example protein target from CASP11 (T0762; PDB ID: 4q5t) (A) An example of the graphical output from the server showing the main results page with a summary of the results from each method. The page starts with the top five 3D models followed by the disorder prediction, domain prediction, ligand binding site prediction and the full model quality results (truncated here to fit page). Clicking on the model images leads to interactive views of models, which can be manipulated in 3D using the JSmol/HTML5 framework and/or downloaded for local viewing. (B) Predicted 3D model (left) and observed (right) tertiary structures are compared using the spectrum colouring scheme (TM-score(27) = 0.92). (C) The disorder prediction plot with residue number on the x-axis and disorder probability on the y-axis. (D) The structural domain prediction is mapped onto the top 3D model—blue: domain1 (disordered), green: domain2, red: domain 3. (E) The top predicted 3D model (left, green) and observed structure (right, cyan) with binding site residues and ligands. The correctly predicted binding site residues [69, 86, 87, 88, 91, 147, 150, 206, 235] are shown as blue sticks and the predicted ligand (MET) is coloured by element. The only under-predicted binding residue [112-SER] is coloured red. The binding site prediction has an MCC score of 0.9468 and a BDT score (29) of 0.9000. (F) Model quality assessment results for the top 3D model. Predicted model quality (left) is compared with observed model quality (right). In the left image the blues and greens represent residues predicted to be closer to the native structure, while oranges and reds represent those that deviate from (or are missing in) the native structure. The right image shows the actual results for the model when compared with the native structure using the same colouring scheme. Below each image are the predicted (left) and observed (right) per-residue error plots with the residue number on the x-axis and the predicted residue error (distance of the Cα atom from the native structure in Ångstroms) on the y-axis. Correlation analysis of the targets suggest that there is a strong positive correlation between the observed and predicted residue scores (Pearson's R = 0.917, Spearman's rho = 0.772, Kendall's tau B = 0.588). The images in B, D, E and F were rendered using PyMOL (http://www.pymol.org/).
