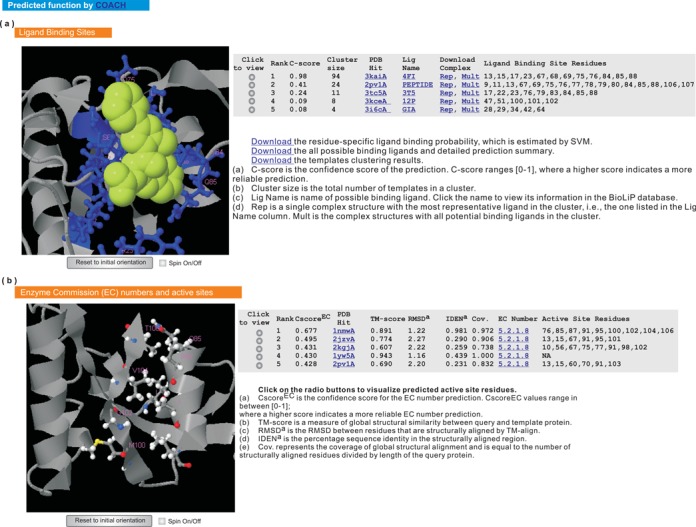
Figure 5.

Illustration of the predicted ligand-binding site, enzyme commission number and active site. The query structure is shown in gray cartoon. (a) The predicted ligand-binding site. The predicted binding ligands and ligand-binding residues are highlighted in yellow-green spheres and blue ball-and-sticks, respectively. For each prediction, two types of complex structures are provided for download, one containing a representative ligand (i.e. the ‘Rep’ link) and the other containing multiple ligands (i.e., the ‘Mult’ link), respectively. (b) The predicted EC number and active site residues are shown in colored ball-and-sticks.
