
Figure 1.
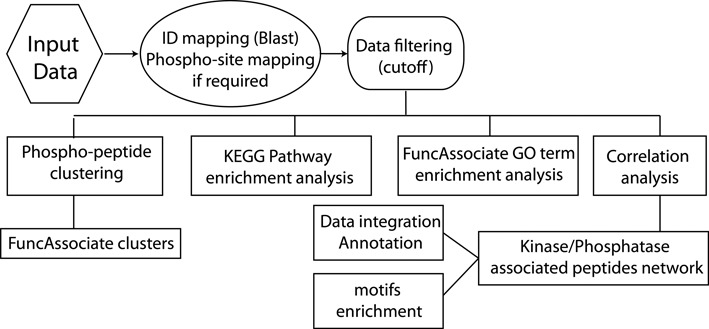
Workflow of SELPHI. SELPHI first identifies the UniprotKB IDs and sequence location of the input phosphosites. The data are then filtered according to the input cutoff and clustering, KEGG pathway/GO term enrichment analysis and correlation analysis is applied on the input data. The result is an exploratory representation of the global effects relating to cell pathways and functions, a network view of potentially relevant kinase/phosphatase/substrate associations with the likely flow of signaling, as well as motifs enriched in the data set.