
Figure 2.
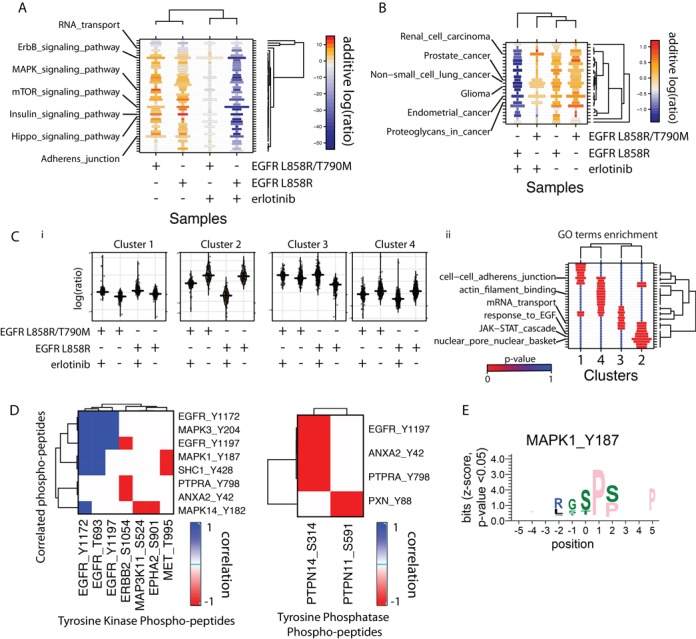
(A) Signaling Pathway and (B) Disease pathway enrichment in the modulated peptides of the case study data set comprising samples collected from adenocarcinoma cells expressing tyrosine kinase inhibitor (TKI) resistant and sensitive EGFR in the presence and absence of the TKI erlotinib (33). The size of the boxes represents the odds ratio of pathway enrichment and the color represents the sum of log(ratios) of the phospho-peptide in each condition shown in the x axis. Clustering was done according to the latter measure. (C) (i) Phospho-profile changes for the peptides in each cluster (ii) GO terms enrichment (5) for each cluster. (D) Heatmaps of correlations between tyrosine kinases and phosphatases and their associated phospho-peptides. (E) Logo (31) of significantly (P-value < 0.05) over-represented residues in the phospho-peptides associated with MAPK1 (Supplementary Table S6) in the case study against a background of 10000 random S/T/Y centered peptides from the non-redundant (at 40% sequence identity) human proteome.