
Figure 2.
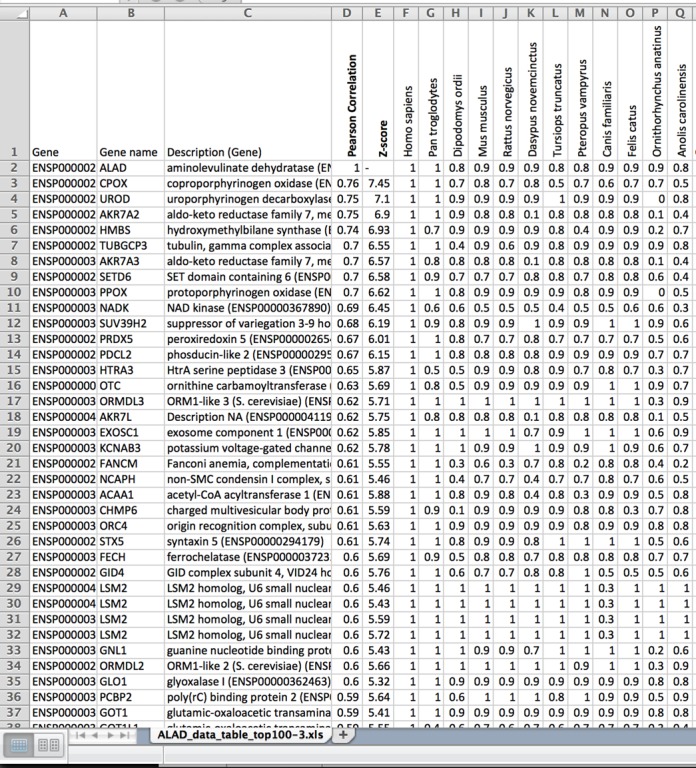
PhyloGene output as a numerical table. The table includes Ensembl IDs, names and short descriptions of proteins with highest profile similarity to the query, and the profiles themselves, as rows of highest protein similarity values across 86 species.