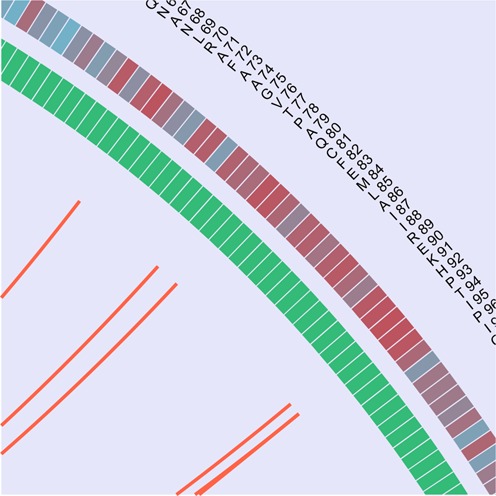
Figure 1.

Circos representation. The outer circos's data track shows the reference sequence residue type and number. The next track (going inward) shows the conservation of that position in the MSA (from red to blue to depict higher to lower conservation respectively). The next track shows to which protein corresponds that position (colored green and violet). Finally, the inner part of the circos shows Bezier curves connecting covarying positions.
