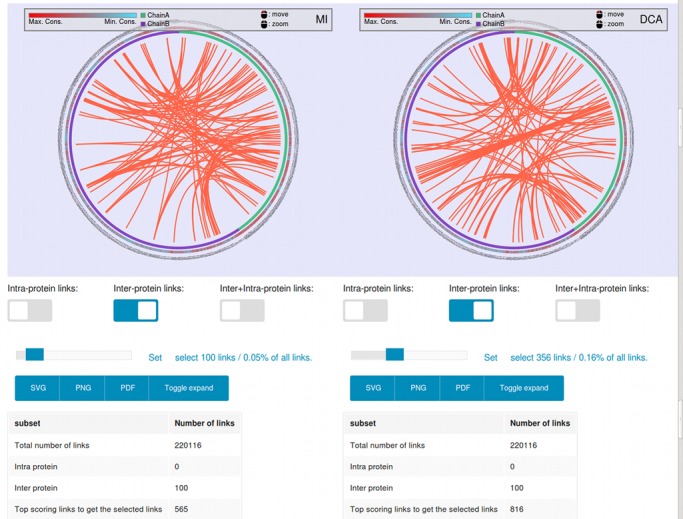
Figure 2.

Snapshot of the single method representation. Right panel: MI method. Left panel: mfDCA method. The shown pairs are the set (selected by the user) of top scoring covarying pairs. The color of the Bezier lines represents the origin of the connected residues. If the curves are green, they both belong to the first protein, if they are violet they both belong to the second protein and if the curves are red then those covarying positions belong to different proteins.
