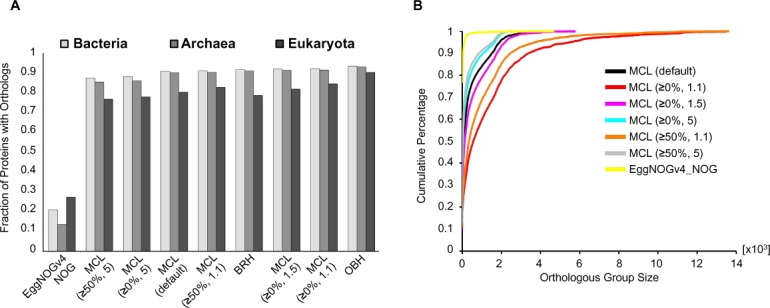
Figure 2.

Differences in orthology prediction methods. (A) Percentage of proteins in each kingdom having at least one orthologous protein in any other species. (B) Cumulative percentage of proteins for different orthologous group size. The smaller the inflation index or the percent match length, the larger the orthologous group size. MCL (≥x, y) refers to the OrthoMCL algorithm with x representing the percent match length and y representing the inflation index.
