
Figure 1.
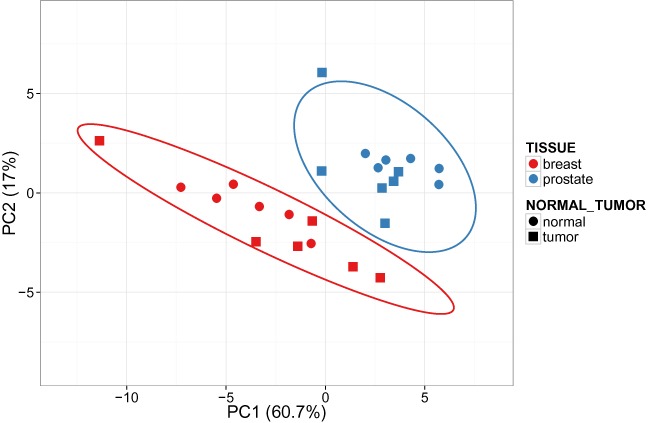
PCA plot of stromal molecular signatures of breast and prostate cancer samples. Ellipses and shapes show clustering of the samples.
Official websites use .gov
A
.gov website belongs to an official
government organization in the United States.
Secure .gov websites use HTTPS
A lock (
) or https:// means you've safely
connected to the .gov website. Share sensitive
information only on official, secure websites.
PCA plot of stromal molecular signatures of breast and prostate cancer samples. Ellipses and shapes show clustering of the samples.