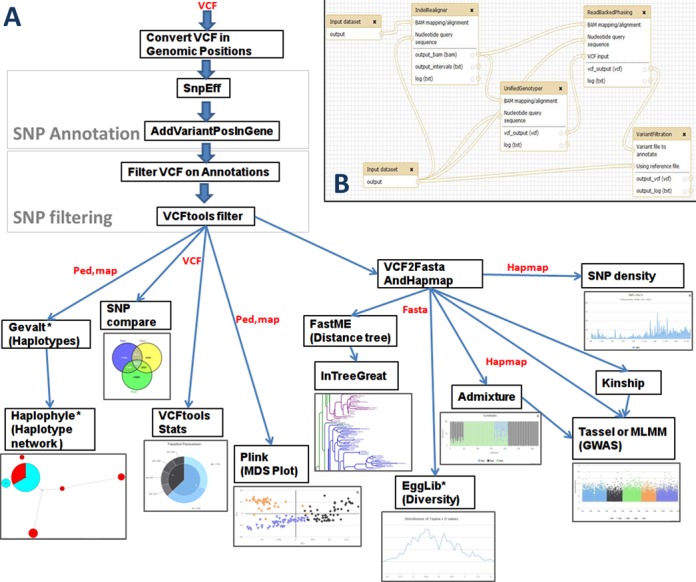
Figure 1.

Overview of the SNiPlay3 process. (A) General schema of the process and graphical layouts of the different modules. For modules marked with an asterisk, analyses are computed gene by gene. Input and output file formats are indicated in red. (B) One of the SNiPlay Galaxy workflows: the SNP calling workflow based on the GATK package for data pre-processing.
