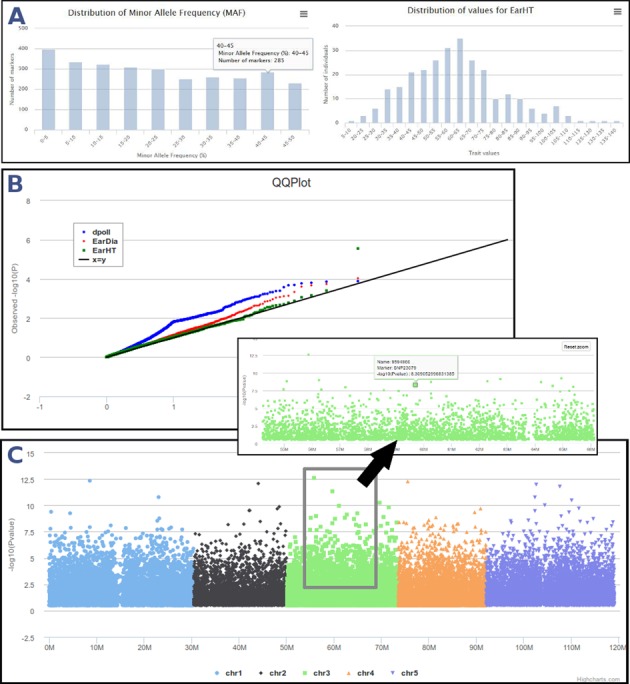
Figure 3.

GWAS analyses in SNiPlay. (A) Data control: first step controls data concordance and outputs some statistics about genotypic (MAF distribution) and phenotypic (phenotypic values distribution) datasets. (B) QQ plot shows the expected distribution of association test statistics (X-axis) compared to the observed values (Y-axis). (C) Result interface displays an interactive Manhattan plot color-coded by chromosome that represents the association P-values between markers and the trait being measured. It supports zooming, which can be achieved by a ‘click, hold and drag mouse’ action on the region of interest.
