
Figure 5.
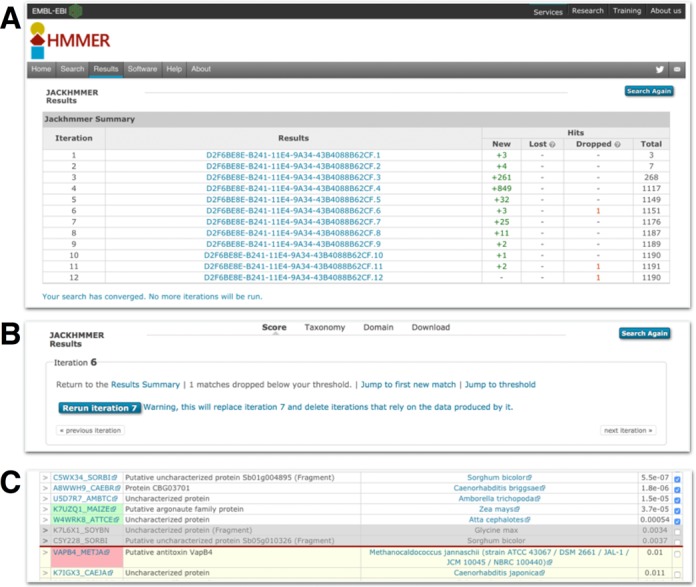
Examples of the jackhmmer user interface. (A) This shows the summary table of a jackhmmer search that has been iterated to convergence. Each iteration is compared to the previous stage and shows the number of new sequences found compared to the previous iteration, the number of sequences lost (see text for details), the number of sequences that were dropped and the total number of sequences. The results job identifier in the second column provides a link through to the results table for that iteration. At the top of the results page for a specific iteration, there is an ‘iteration’ box (B). This provides information about the iteration and a series of links to navigate to the summary page, or previous or next iteration results, to re-run iterations or to navigate the results. If any sequences have been lost, a link to a table listing those sequences is provided. (C) Shows the results on either side of the inclusion threshold (red horizontal line). The rows containing sequence accessions with a green background indicate new sequences that were not previously above threshold. The row containing a sequence accession with a pink background is a sequence that is no longer significant, but was in the previous iteration, i.e. dropped. The grey rows indicate the sequences that have been manually de-selected by the user and will not be used in the subsequent iteration.