
Figure 2.
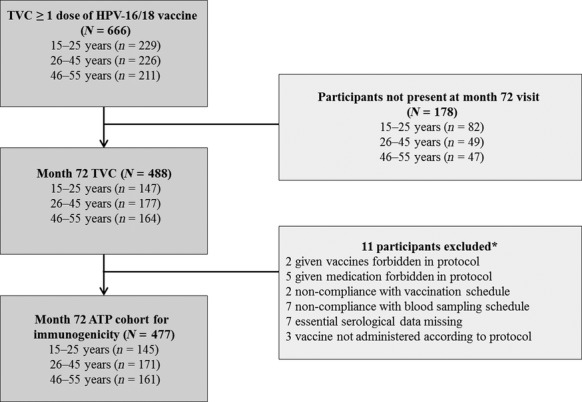
Flow chart of study participants. Key: 15–25 years, women aged 15–25 years at the time of first vaccine dose; 26–45 years, women aged 26–45 years at the time of first vaccine dose; 46–55 years, women aged 46–55 years at the time of first vaccine dose; ATP, according to protocol; N = total number of women; n = number of women in the age group; TVC, total vaccinated cohort. *Participants may have more than one reason for exclusion.