
Figure 3.
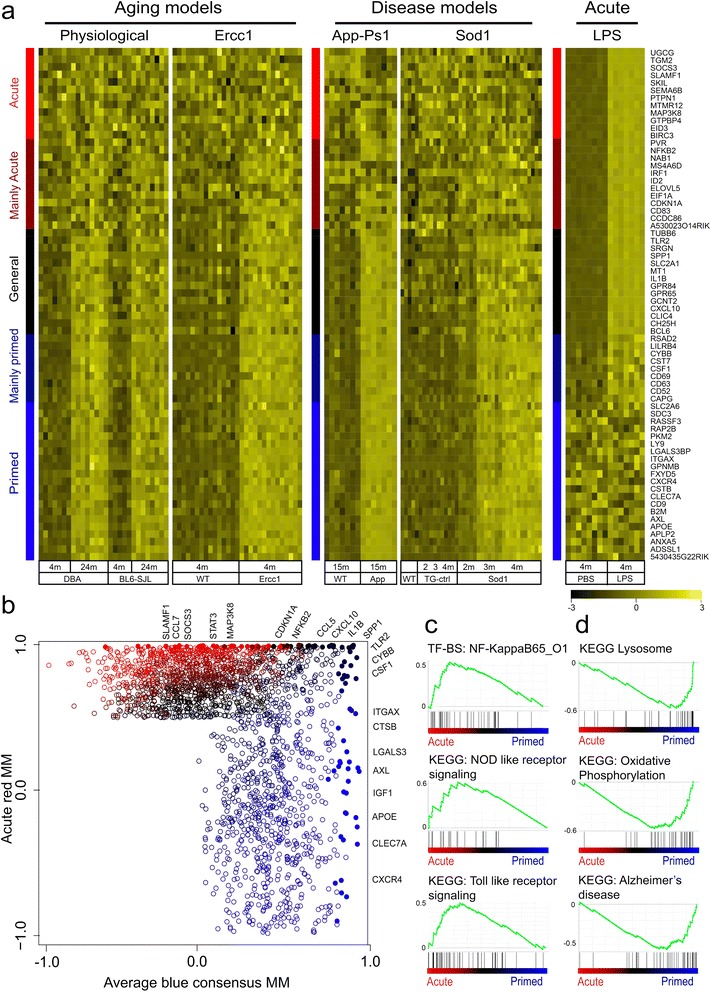
(Dis)similarities in primed and acutely activated pure microglia. a) Heatmaps of acute to chronic activation categories. Hub genes (or genes that are centrally located in a module) were assigned by module membership. The 35 most correlated genes from the acute red and primed microglia blue module were categorized in 5 categories and depicted using a sidebar. “Acute-unique” hubs (red sidebar), “Mainly Acute” hubs with (lower) significant association in any of the primed models (dark-red sidebar), “General” hubs (black sidebar), “Mainly primed” hubs (dark blue sidebar) and “Primed” unique hubs (blue sidebar). b) Scatterplot of priming blue and acutely activated red module membership values. For each gene which was significantly associated to either the acute or the primed networks, module membership values for the acute red and primed blue modules were plotted. Top 50 most connected hubs genes from acute and consensus primed microglia networks were assigned one of the five colors as described under a (filled dots). c, d) Gene set enrichment analysis of primed and acutely activated microglia. c) Acute activated microglia were significantly enriched for NF-?B, NOD, and TLR signaling, d) Primed microglia were enriched for KEGGs lysosome, oxidative stress, and AD-signaling.