
Fig. 3.
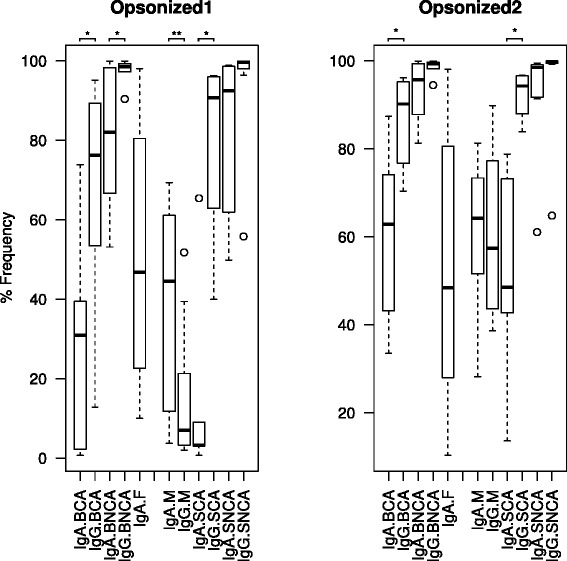
Ig-coating levels in different human samples. Boxplots show the mean values and variation in IgA- and IgG-opsonization levels for oral biofilm (B), milk (M), fecal samples (F), and saliva (S). Asterisks indicate statistically significant differences between IgA and IgG coating (Wilcoxon test, p < 0.05). For saliva and oral biofilm, samples from Caries-free (NCA) and Caries-bearing (CA) individuals are available. Data are shown for a conservative (Opsonized 1) and a non-conservative (Opsonized 2), upper estimate of Ig-coating. Individual data are shown in Additional file 2: Table S1