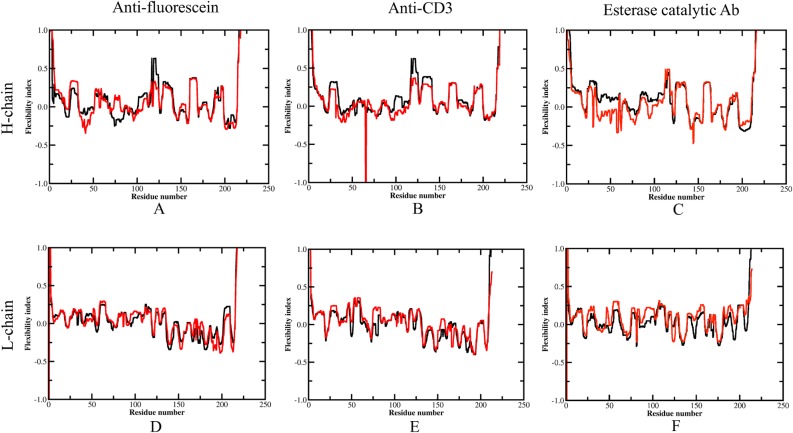
Fig 4. Average flexibility index for each antibody H and L chains.
(A) and (D) are flexibility index for anti-fluorescein antibody H and L chain, respectively. (B) and (E) for anti-CD3 antibody. (C) and (F) for esterase catalytic antibody. Black and red curves represent flexibility index for GL and AM antibodies, respectively. Reported values correspond to the appropriate weighted average (defined in methods) over 10 representative structures sampled from the MD trajectory.

