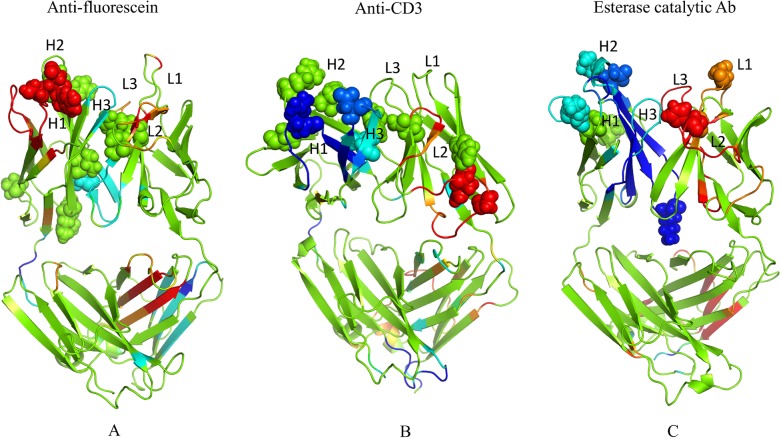
Fig 5. Changes in mechanical properties upon maturation.
Differences in rigidity/flexibility between GL and AM antibodies across the dataset are projected onto the structures and indicated by color: green = no change; cyan and blue = moderate and large rigidity increases; and orange and red = moderate and large increases in flexibility. The mutations are displayed in spheres. In each case, the color represents a certain z-score range for differences that are defined within S3 Fig.

