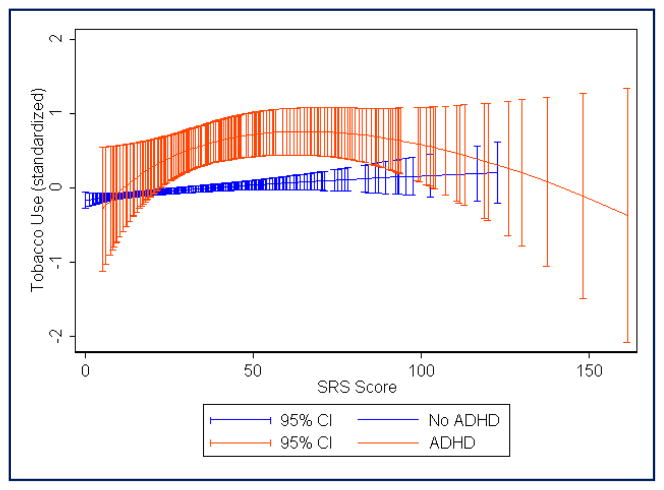
FIGURE 3.
Fractional polynomial regression plot showing estimated mean tobacco use score (standardized with mean = 0, standard deviation = 1) across the range of Social Responsiveness Scale raw scores. Red, Attention-deficit/hyperactivity disorder (ADHD) diagnosis; blue, no ADHD diagnosis. Total N = 2937 (290 with ADHD)

