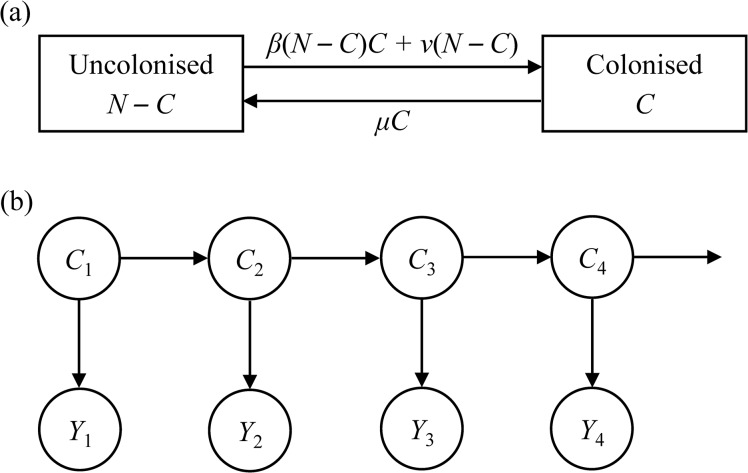
Fig 2. Mechanistic transmission model of A. baumannii (Fig 2A) and hidden Markov model (Fig 2B).
β, cross-transmission coefficient; C, number of colonised patients; μ, discharge rate; N, ward size; ν, sporadic acquisition coefficient. In Fig 2B, the horizontal arrows represent the transition from one state to the next. The vertical arrows represent the probability relationship between the hidden state (C) and the corresponding observation (Y).

