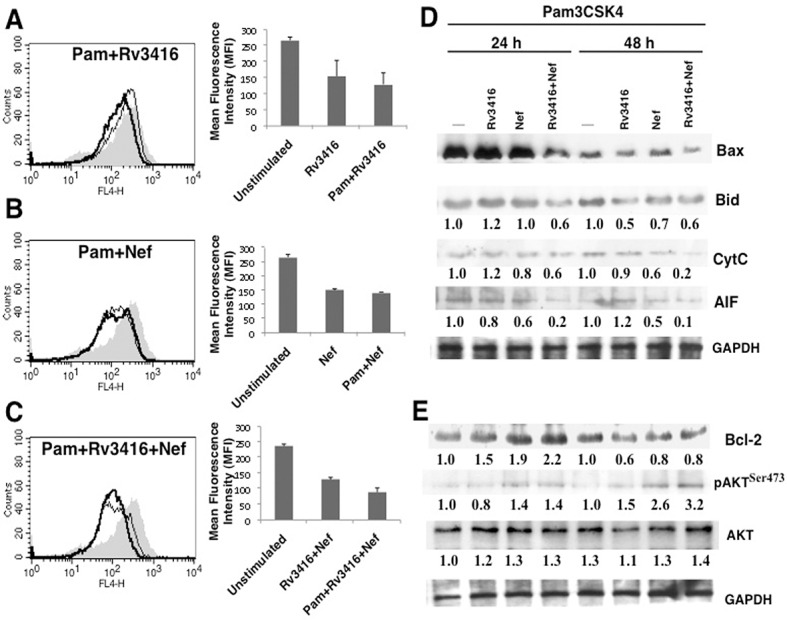
Fig 2. TLR2 co-stimulation exacerbates Rv3416 and Nef mediated inhibition of apoptosis in macrophages.

PMA stimulated THP1 cells were stimulated with 20 μg/ml Rv3416 (Panel A, thin line) or 15 μg/ml Nef (Panel B, thin line) or both (Panel C, thin line) or in the presence of 1 μg/ml TLR2 ligand Pam3CSK4 (Panel A-C; indicated as Pam) for 24h. Cells were stained with Annexin V-APC. Thick lines in Panels (A-C) represent stimulation as indicated in the figure. Bar graphs adjacent to histograms in Panel (A-C) show relative MFIs of the histograms. Data from one of three independent experiments are shown. For Panel D and E, PMA stimulated THP1 cells were stimulated with 1 μg/ml Pam3CSK4 along with 20 μg/ml Rv3416 or 15 μg/ml Nef or both for 24h or 48h. Cytoplasmic extracts were prepared post-stimulation and western blotted for indicated molecules. Numbers below the blots indicate the relative intensities of the bands. Data from one of three experiments are shown. In Panel C, P<0.016 for Unstimulated vs Rv3416+Nef; P< 0.023 for Rv3416+Nef vs Pam+Rv3416+Nef.
