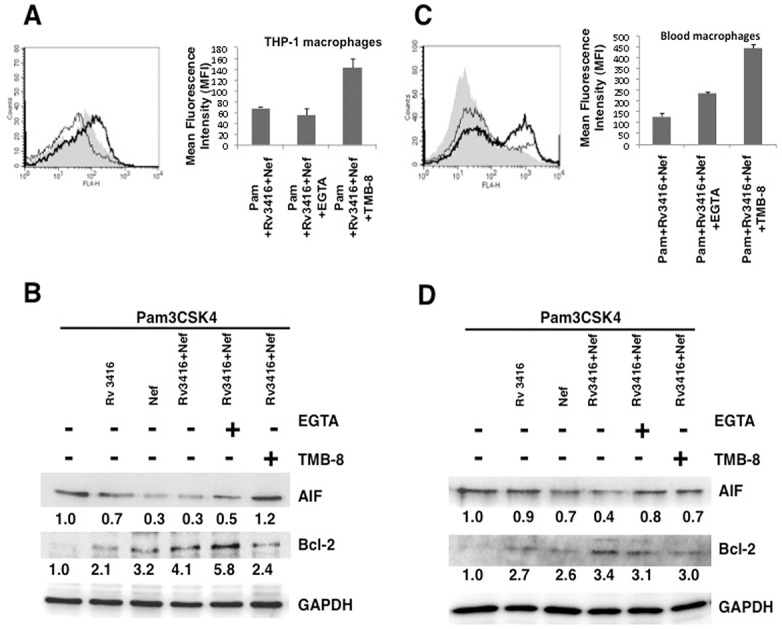
Fig 4. Route of calcium influx differentially regulates apoptosis in macrophages by Rv3416 and Nef.

Either PMA stimulated THP1 macrophages (Panel A and B) or blood monocyte derived macrophages (Panel C and D) were treated with inhibitor to either calcium influx from external medium (EGTA; thin lines) or calcium influx from internal stores (TMB-8; thick lines) for 1h and stimulated with 1 μg/ml Pam3CSK4 along with 20 μg/ml Rv3416 and 15 μg/ml Nef for 24h. At the end of the incubation period cells were stained with Annexin V-APC. Shaded histograms in Panel A and Panel C represent cells stimulated with 1 μg/ml Pam3CSK4 along with 20 μg/ml Rv3416 and 15 μg/ml Nef for 24h. Bar graphs adjacent to histograms in Panel A and Panel C show relative MFIs of the histograms. Data from one of three independent experiments are shown. For Panel B (THP-1 macrophages) and Panel D (blood macrophages) were treated as indicated for 24h. Cytoplasmic extracts were probed for indicated molecules and analyzed by western blots. Numbers below the blots indicate the relative intensities of the bands. Data from one of three experiments are shown. In Panel A, P<0.04 for Pam+Rv3416+Nef vs Pam+Rv3416+Nef+EGTA. P<0.01 for Pam+Rv3416+Nef vs Pam+Rv3416+Nef+TMB8. In Panel C, P<0.05 for Pam+Rv3416+Nef vs Pam+Rv3416+Nef+EGTA. P<0.03 for Pam+Rv3416+Nef vs Pam+Rv3416+Nef+TMB8.
