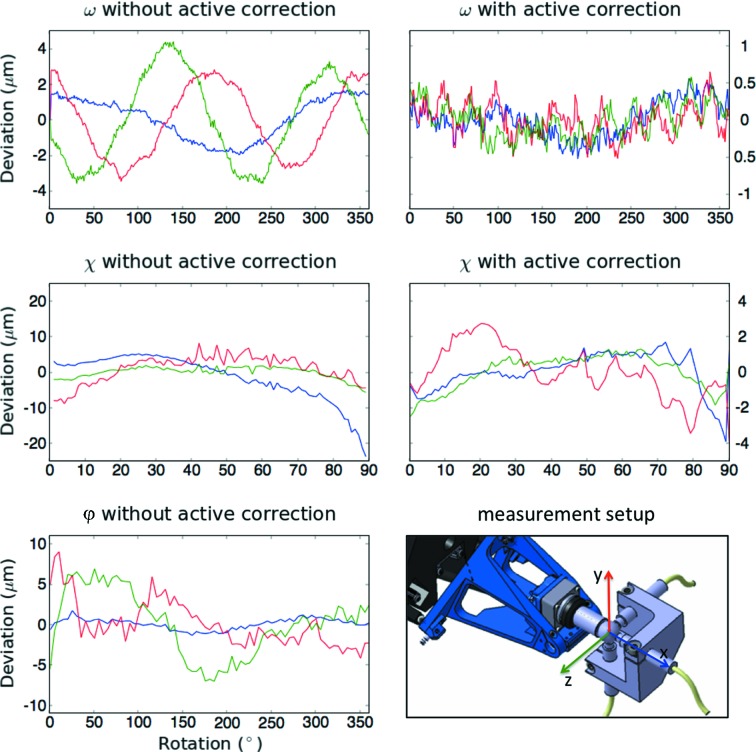
Figure 4.
PRIGo’s sphere of confusion measurements for ω, χ and ϕ rotation axes. PRIGo SoC measurements and calibration were performed with three capacitive sensors aligned with the beamline coordinate system (see ‘measurement setup’ insert) and a metal sphere representing the sample. The plots represent the SoC obtained by optimization of PRIGo’s geometric model (without active correction) and after the implementation of an active correction (with active correction). The deviations along x, y and z from the ideal sample position are indicated in blue, red and green, respectively. During the measurement of an axis, the other two were kept at an angle of 0°. There is currently no active correction implemented for the ϕ axis. All SoC measurements were performed at 1° s−1 and reproducible within 200–300 nm.

