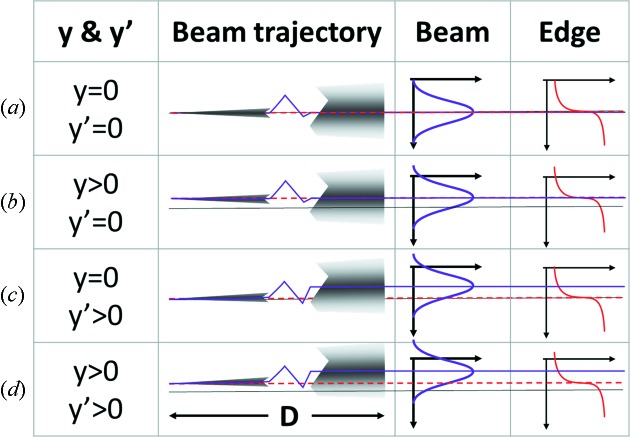
Figure 5.
Schematic showing the effects of the electron beam position and angle displacements. The first column gives the position and angle, the second column is a schematic of the beam where the monochromator has been removed for clarity, the third and fourth columns show the beam and edge profile, respectively. The black line in each row represents the electron beam position and angle zeros, the purple line shows the centroid of the beam, the red dashed line shows the location of the same angle to the monochromator crystal or the edge location. (a, c) At y = 0. (a, b) At y′ = 0. (b, d) At y > 0. (c, d) At y′ > 0.

