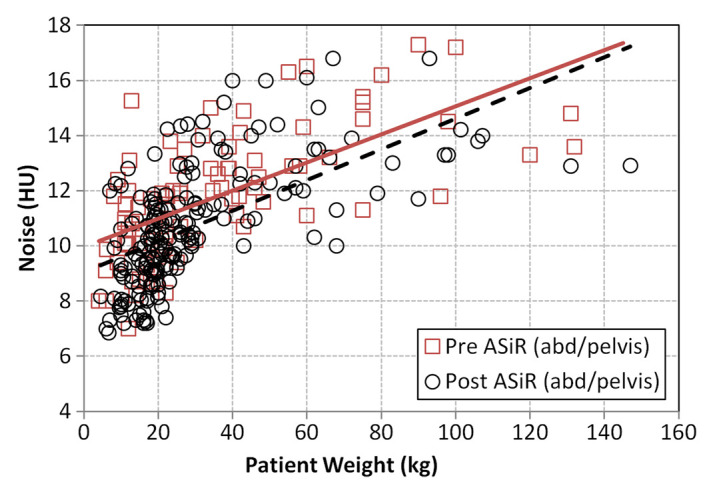
Figure 2b:

Graphs show image noise as measured in patient images reconstructed at 0% ASIR and at 40% ASIR for (a) the chest and (b) the abdomen and pelvis. Regression plots for pre-ASIR (dashed line) and post-ASIR (solid line) chest and abdominopelvic examinations are provided for comparison.
