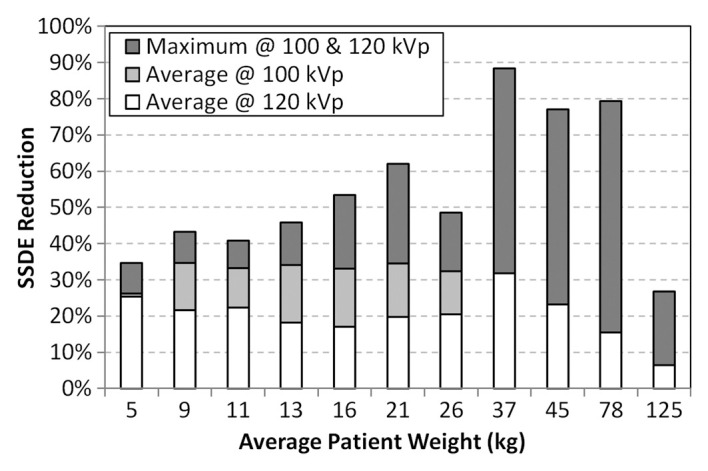
Figure 5b:

Bar graphs show additive effect of incremental patient dose reduction. First, SSDE reduction was calculated for 40% ASIR implementation for imaging at 120 kVp for both (a) chest and (b) abdominopelvic CT protocols (white bars). Additional dose reduction was then calculated for imaging at 100 kVp (for patients between 0 and 31.5 kg), which provided additional dose savings to the reported 120 kVp reduction levels (ie, total dose savings = white bars + light gray bars). Finally, the maximum dose reduction for imaging at both 100 kVp and that at 120 kVp is shown relative to the mean dose savings (dark gray bars).
