
FIGURE 2.
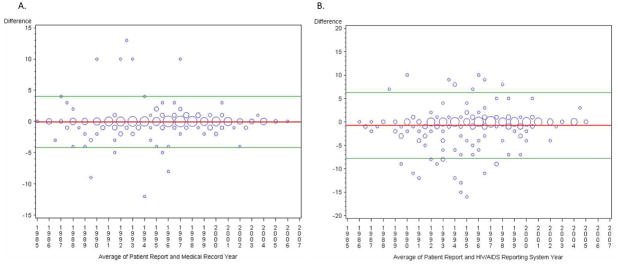
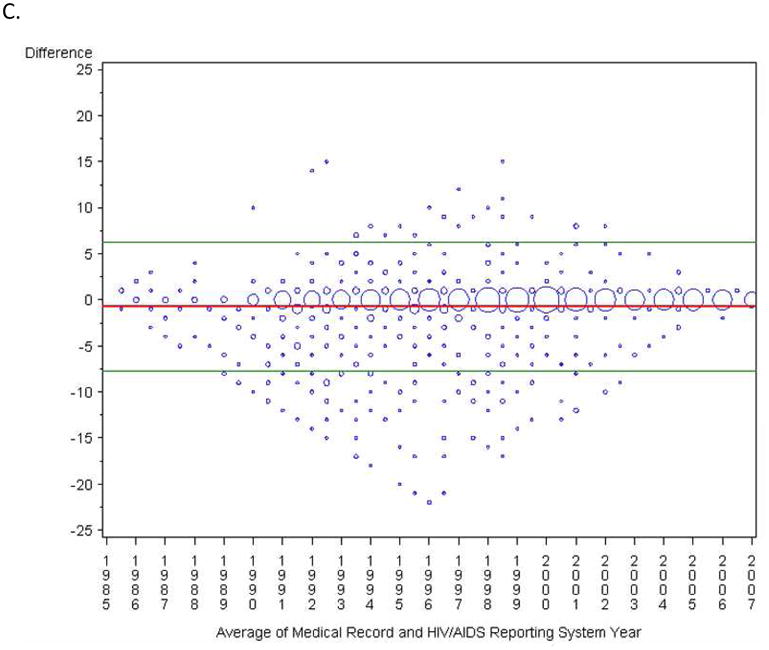
Comparison of sources of the year of HIV diagnosis presented as a plot of the difference in years against the mean with mean difference and 95% limits of agreement indicated.1 Sizes of the data points are proportional to the number of observations. Panel A: Comparison of patient report and the medical record; Panel B: Patient report and the HIV/AIDS Reporting System; Panel C: Medical Record and the HIV/AIDS Reporting System.