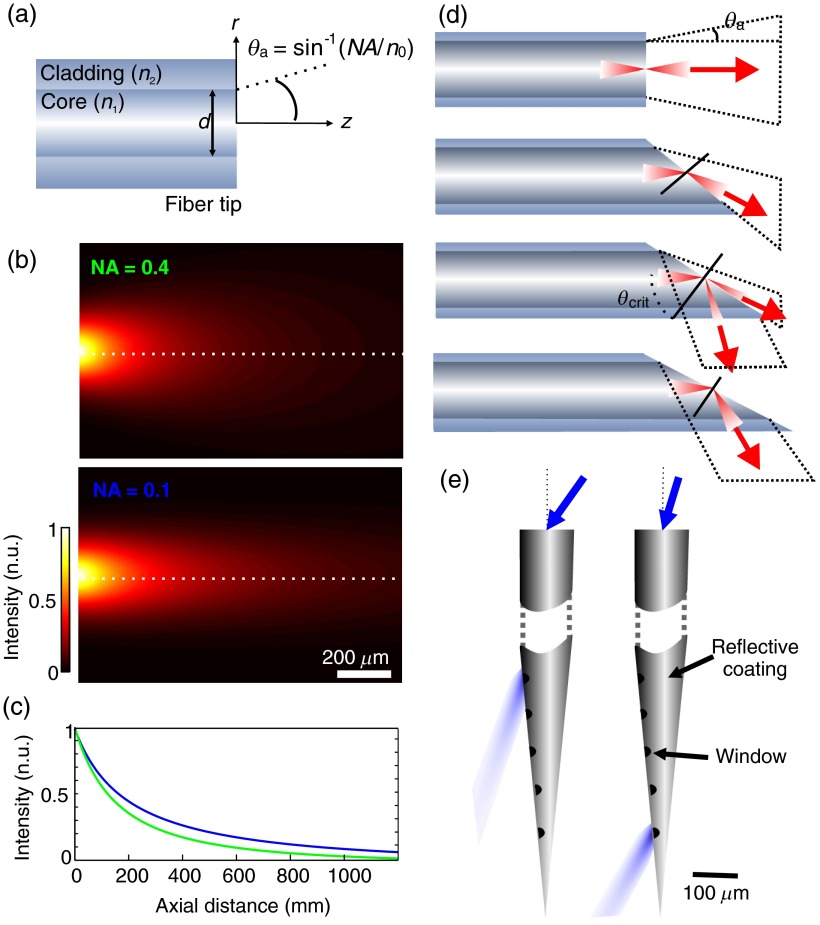
Fig. 2.
Tissue irradiance profiles and strategies for controlled light delivery: (a) schematic representation of an optical fiber tip and the calculated irradiance profile (b) at its tip for and ; the diameter of the fiber core used in the calculation was and values of absorption and scattering were chosen for a wavelength of 473 nm; (c) axial normalized intensity profile at fiber center, corresponding to the dashed lines in (b); (d) different irradiance profile obtained from different tip geometries (adapted from Vo-Dinh70); (e) flexible illumination location from a coated tapered fiber (adapted from Ref. 71). Optical windows ( wide) were made along the tapered shaft. Using different light input angles, different zones are illuminated.

