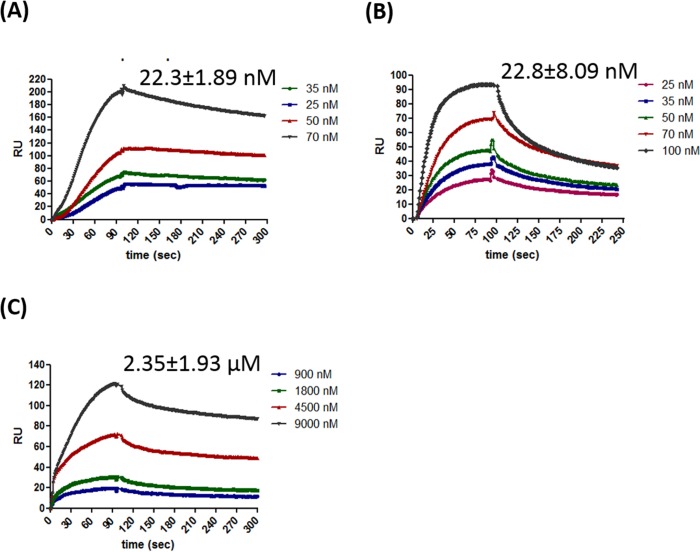
Fig 3. Surface plasmon resonance analysis of homotopic protein interaction between full length HpDprA, HpRF and HpDML1.
Sensorgrams showing self-interaction of (A) HpDprA (B)HpRF and (C)HpDML1. The concentration of soluble analytes and affinity constant (Kd) values are indicated in the inset to figures. The Kd values are determined as described in materials and methods.

