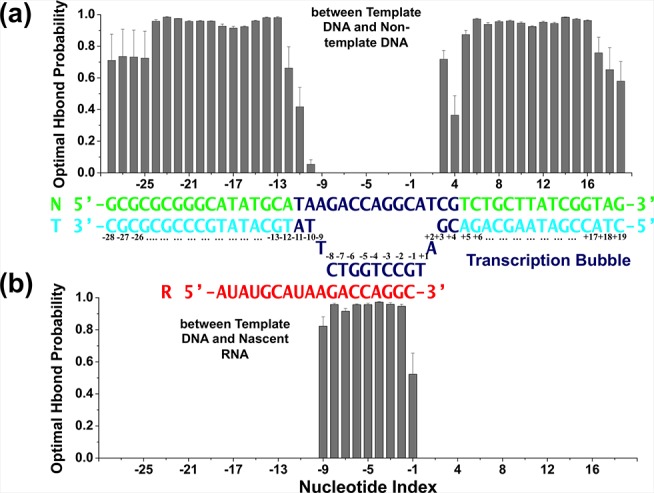
Fig 3. Structural validation of the model by MD simulations: Base-pairing stability.

The bar plots show the probability of finding the optimal number of hydrogen bonds for: (a) between the template and non-template DNA strands, and (b) between the DNA-RNA hybrid. In the middle, the nucleic acid scaffold scheme is demonstrated with the region where the DNA duplex opens to form the transcription bubble shown in dark blue.
