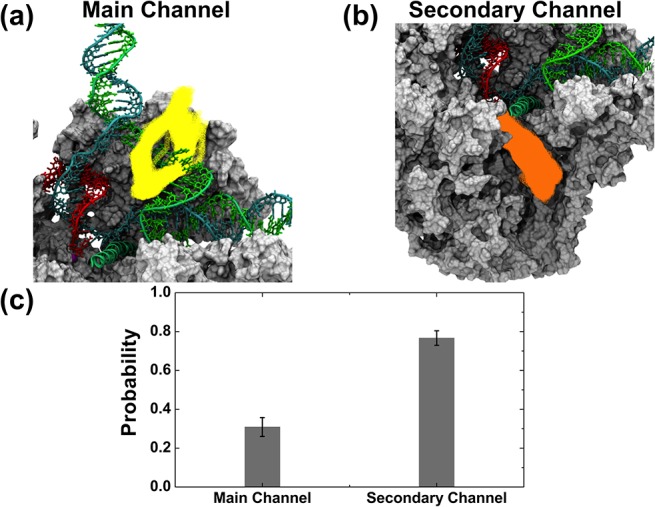
Fig 4. The secondary channel exhibits higher probability for NTP entry than the main channel.

The cavity analysis was performed using the program CAVER (see Methods) with an ensemble of MD conformations of the elongation complex (without NTP). (a) The most possible pathways with enough space to allow the pre-loading of a NTP to the i+2 site are shown in yellow. Similarly, (b) shows the most possible pathways for a NTP to reach the active site in orange. In (c), the bar plot shows the probability of finding MD conformations with enough space for NTP diffusion through the main channel versus the secondary channel (see Methods). The template DNA (cyan), non-template DNA (green) and RNA (red) strands are shown with tube and licorice representations. The protein components are shown in grey with a cut view with a surface representation.
