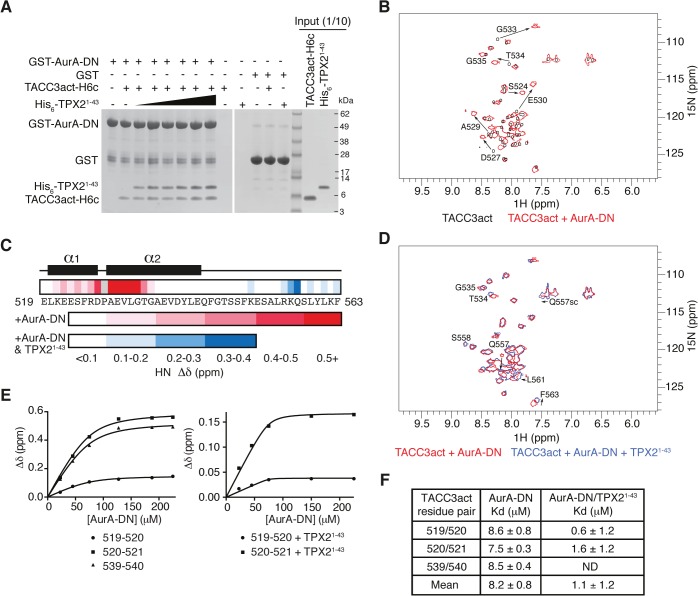
Fig 2. Biophysical characterisation of Aurora-A binding to TACC3act and comparison with TPX21-43.
(A) Co-precipitation assay between GST-AurA-DN and TACC3act-H6c and His6-TPX21-43. 5 μM TACC3act-H6c was used in reactions with 1, 2, 5, 10, 20 and 50 μM His6-TPX21-43 (black triangle). GST was used as a binding control. (B) 1H-15N HSQC spectra of 15N-labelled TACC3act in the absence (black) and presence (red) of AurA-DN. TACC3act residues are labelled and chemical shift changes observed on interaction with AurA-DN are marked with arrows. (C) Summary of NMR data mapped onto the primary sequence of TACC3act. Changes in backbone chemical shifts (Δδ) upon binding to Aurora-A are shown on a scale from low (white) to high (red), based on S1C Fig. Secondary structure content is derived from S2 Fig. Chemical shift changes in the presence of TPX21-43 are shown on a scale from low (white) to high (blue) using data in S1D Fig. No data is available for P528 (coloured grey) because it lacks a backbone N-H. (D) 1H-15N HSQC spectra of 15N-labelled TACC3act in the presence of AurA-DN (red) and on the addition of TPX21-43 (blue). TACC3act residues are labelled and chemical shift changes observed on interaction with TPX21-43 are marked with arrows. (E) TACC3act chemical shift changes associated with increasing concentrations of AurA-DN were monitored in the absence (left) or presence (right) of TPX21-43 and fit to Eq 1. (F) Binding affinity of TACC3act for AurA-DN in the absence and presence of TPX21-43 as determined in Fig 2E. ND, not determined.

