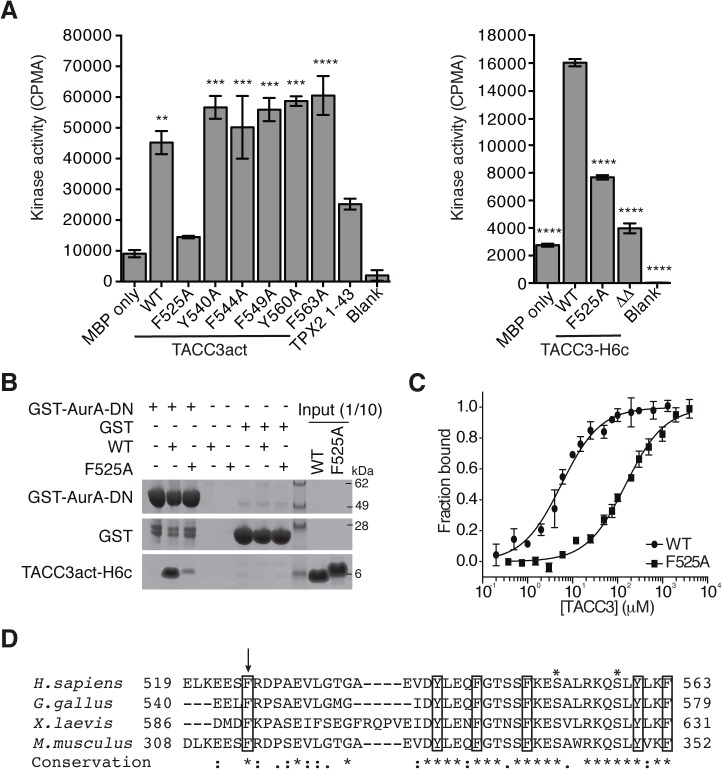
Fig 3. Mapping of key determinants for TACC3 binding to Aurora-A.
(A) In vitro kinase activity assay of Aurora-A 122–403 in the presence of TACC3act, TACC3-H6c and TACC3 mutants. ΔΔ, TACC3-H6c Δ519–546 and Δ564–629. Stimulation of Aurora-A catalytic activity by TACC3 was determined by incorporation of 32P into MBP and quantified by scintillation counting. TPX21-43 was used as a positive control for Aurora-A activation. Error bars represent the standard error for two independent reactions. ** = P<0.01, *** = P<0.001 and **** = P<0.0001 using one-way ANOVA with Dunnett's post-hoc test compared to the MBP only reaction (left) and compared to the WT reaction (right). (B) Co-precipitation assay to assess binding between GST-AurA-DN and TACC3act-H6c (WT) and the point mutant, TACC3act-H6c F525A (F525A). GST was used as a binding control. (C) Binding affinities of Aurora-A 122–403 C290A, C393A for TACC3act-H6c WT and F525A were determined using microscale thermophoresis. Data were fitted to Eq 2. Error bars represent the standard deviation of 3 measurements. (D) Multiple sequence alignment of TACC3 homologues within the minimal Aurora-A binding region. Asterisks above the alignment mark Aurora-A phosphorylation sites. Sequence conservation is shown below the alignment: ‘*’ indicates identical residues, ‘:’ identifies conservative substitutions and ‘.’ represents semi-conserved substitutions. Conserved aromatic residues are marked with black boxes. Residue F525 is marked with an arrow.

