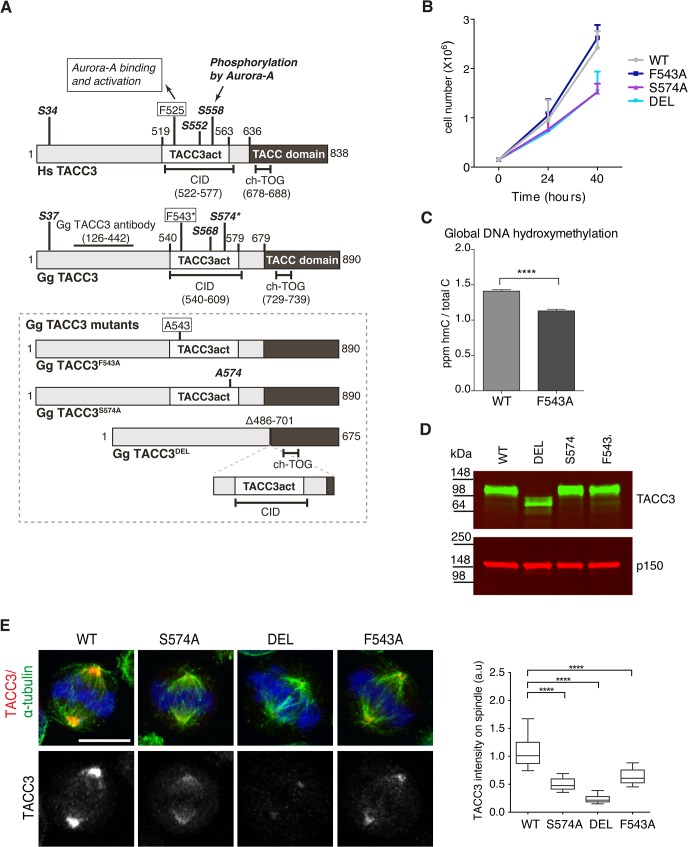
Fig 5. F543 in TACC3 is required for efficient targeting of TACC3 to the mitotic spindle.
(A) Graphical illustration of domain organization, numbering and properties of key residues in Homo sapiens (Hs) and Gallus gallus (Gg) TACC3 proteins. Framed area below shows properties of mutant TACC3 protein products expressed in F543A, S574A and DEL cells, respectively. (B) Growth curves are shown for WT and mutant cell lines. n = 3 technical replicates, error bars represent standard deviation. (C) Measurement of 5-hydroxymethylcytosine (hmC) by tandem liquid–chromatography mass spectrometry in cells. hmC levels are expressed as parts per million (ppm) of total cytosines or ‘C’. Note that hmC levels inversely correlate with proliferation rate [56]. n = 3 technical replicates. Statistical significance was assessed using t-test (**** P < 0.0001). (D) Western blot shows TACC3 protein levels in the DT40 cell lines with genotypes as indicated. The p150 subunit of dynactin serves as loading control. (E) TACC3 localisation to the mitotic spindle is impaired in all three mutant DT40 cell lines. In merged images α-tubulin is green, TACC3 is red and DNA is blue. Scale bar = 5 μm. Box plot on right depicts intensity of TACC3 staining on the mitotic spindle. TACC3 signal intensity was quantified in mitotic spindle volumes defined by α-tubulin staining. A minimum of 60 cells was scored per genotype. Statistical significance was assessed using t-test (**** P < 0.0001).

