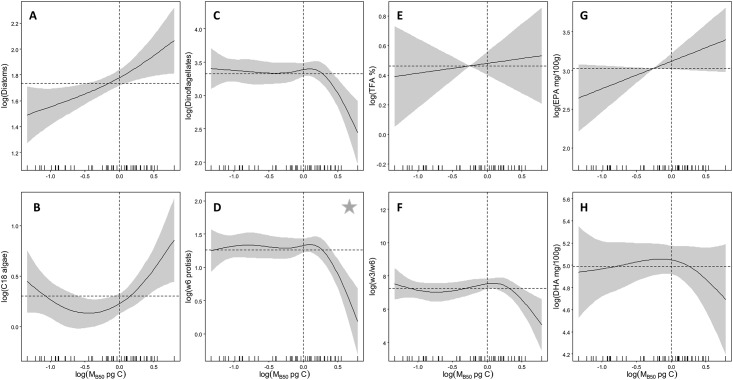
Fig 1. Relationship between observed median phytoplankton cell mass and GAMM predicted fatty acid parameters in albacore.
Fatty acid parameters include those representative of: (A) diatoms, (B) C18 algae, (C) dinoflagellates, (D) ɷ6 protists, (E) total fatty acid content (% of tissue), (F) ratios of ɷ3/ɷ6, (G) EPA, and (H) DHA. The dashed horizontal black lines represent the intercept (or zero line) in each plot. The dashed vertical lines approximately delineate the range of the explanatory variable above the zero line used as thresholds. The solid grey area bracketing the response curves show the confidence limits of the model and are twice the standard error. A star represents the model fit for that particular response variable with the highest % deviance explained (S3 Table).

