
Figure 3.
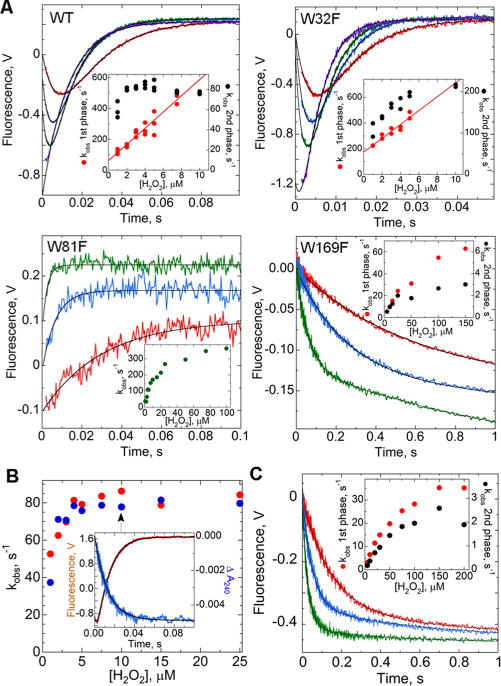
Kinetic profiles of intrinsic Trp fluorescence and absorbance changes of wild-type and mutant AhpC during H2O2-mediated oxidation. (A) Reduced AhpC (1 μM) in reaction buffer [25 mM potassium phosphate (pH 7) with 1 mM EDTA and 100 mM ammonium sulfate] at 25 °C was mixed in a stopped-flow spectrofluorometer with increasing concentrations of H2O2, with representative traces colored red, blue, green, and purple (1, 3, 5, and 20 μM for the wild type, 1, 3, 5, and 15 μM for W32F, 2, 10, and 100 μM for W81F, and 2, 4, and 25 μM for W169F). All concentrations are after mixing. All data (except for W81F) fit to a double exponential (black lines) yielded rate constants for the fast (red) and slow (black) phases, plotted vs H2O2 concentration in the insets. For ease of viewing, starting voltages for each set were adjusted to 0; note that voltages in each panel are not directly comparable. Traces for W81F, fit to a single exponential (with rate constants shown in the inset), have been offset consecutively by 0.1 V. (B) Same as panel A, with reduced AhpC (1 μM) mixed with a range of H2O2 concentrations, monitoring changes in absorbance at 240 nm (blue) and in fluorescence (red) in identical mixings. The slower rate constants from the fluorescence changes fit as in panel A match closely the rate constants for the absorbance changes at 240 nm (from a single-exponential fit). Shown in the inset are representative data from the experiment with 10 μM H2O2. (C) Similar to panel A, 2 μM reduced C165S AhpC was mixed with H2O2 at 10 (red), 50 (blue), and 200 μM (green).