
Figure 5.
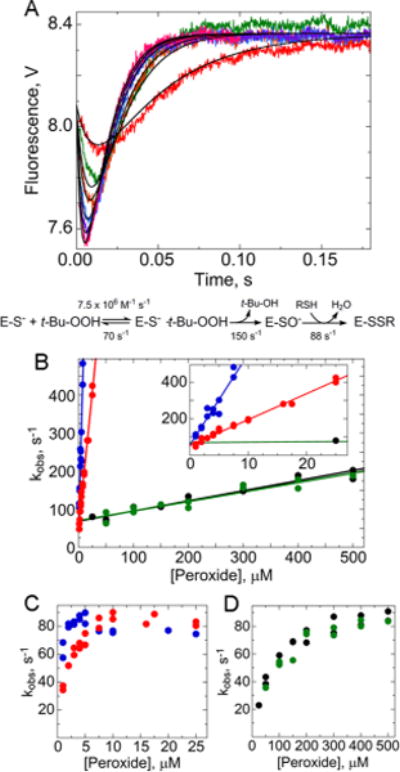
Rapid reaction kinetics of AhpC oxidation by various hydroperoxides. (A) Oxidation of wild-type AhpC by 50 (red), 150 (green), 200 (orange), 300 (blue), 400 (purple), and 500 μM tert-butyl hydroperoxide (t-Bu-OOH) (magenta) monitored by Trp fluorescence. Methods used were identical to those described in the legend of Figure 2. Data were fit to a three-step model as in Figure 4, shown below the plot. In panels B–D, blue indicates data for H2O2, red those for ethyl hydroperoxide, green those for t-Bu-OOH, and black those for cumene hydroperoxide. Results from two independent experiments are shown for each hydroperoxide. Panel B shows the rate of the fast, initial decrease for the four hydroperoxides, zooming in on values at low concentrations in the inset. Panels C and D show that all the substrates approach the same maximal rate for the exponential increase in fluorescence, with the slower substrates requiring higher concentrations.