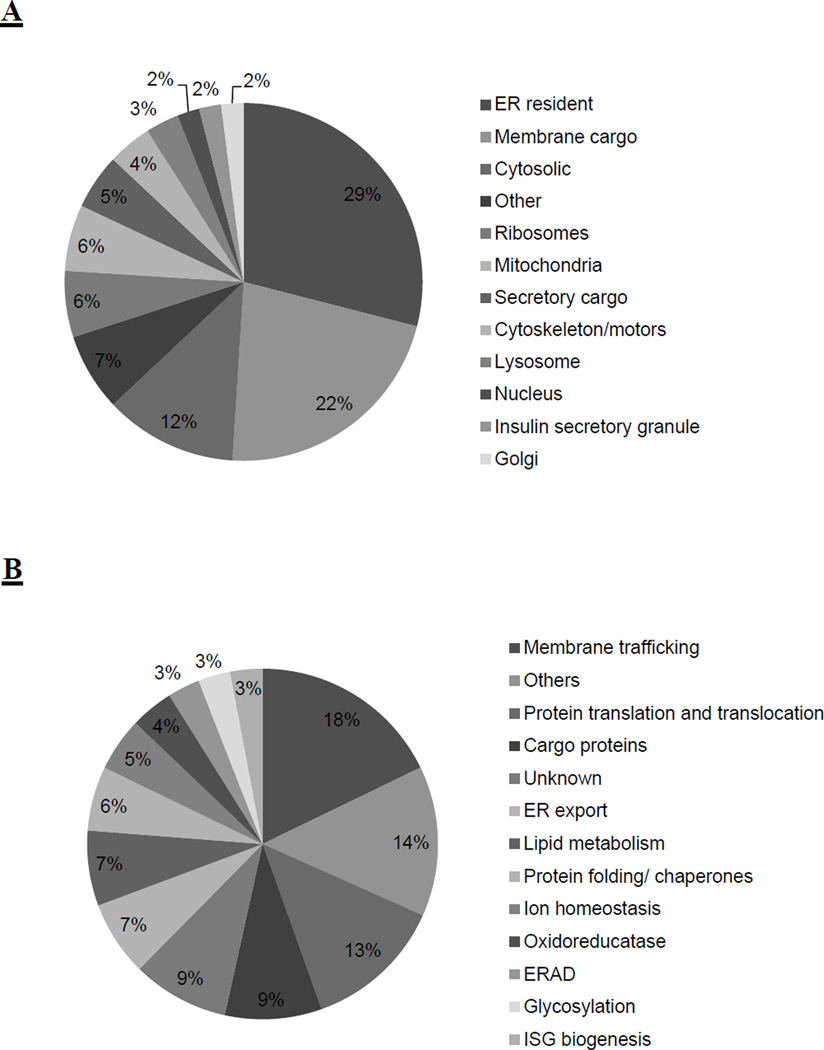
Figure 2. Classification of the identified proteins from purified rER in MIN6 cells.
A, Subcellular localization of proteins identified in all three experiments were analyzed and presented as percentage of the total 725 proteins. B, 670 identified rER and associated proteins were classified in thirteen functional categories. The percentage of total proteins in each category is illustrated in the pie chart. In both charts, the categories are sorted from the highest percentage to the lowest percentage.

