
Figure 9.
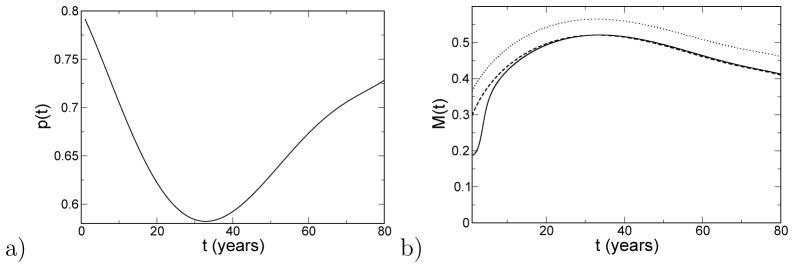
a) The clustering of memories versus age, after the bottom arrow in Fig. 8. b) The average modularity versus age predicted by quasispecies theory (solid). Here, the fitness is 10× the overlap in Fig. 8, and the rate of mutation is μ = 0.1 [46]. Also shown is the adiabatic approximation to the modularity, M∞ (dashed) as well as the modularity that maximizes the fitness, M* (dotted).