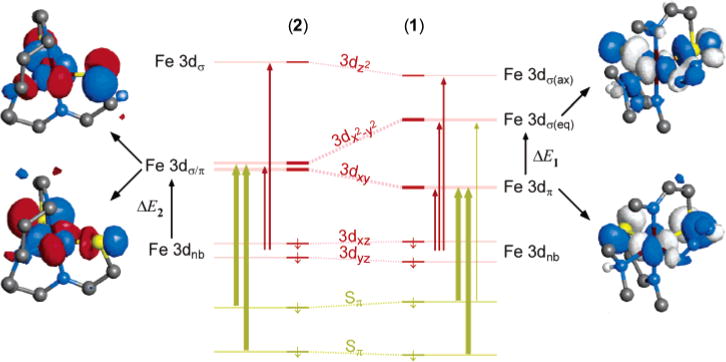
Figure 10.

Summary of spectroscopic model used to interpret the observed Abs/MCD spectra and the overall electronic structures of complexes 1 and 2. The orbital splitting is that of the minority spin orbitals for each model complex; the most important spin-allowed transitions are indicated (<25000 cm−1). The orbital description of the 3dxy and orbitals in each complex is also given to emphasize the change in bonding between 2 and 1.
