
Figure 3.
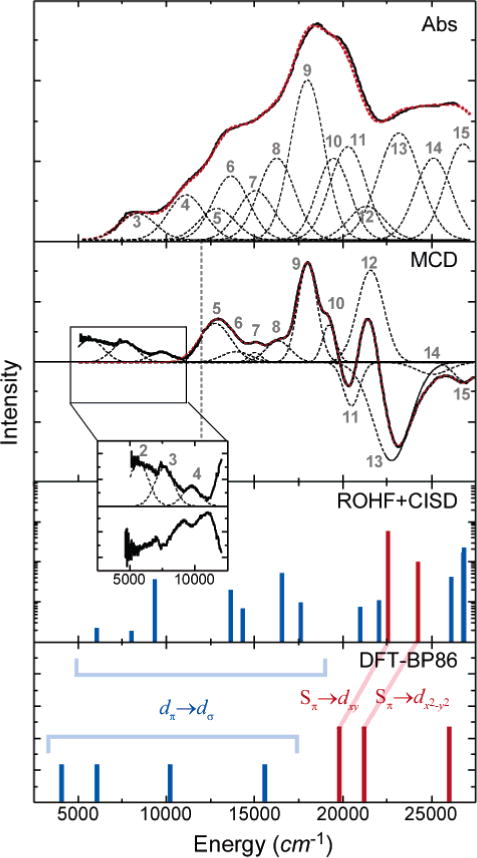
Low-temperature spectroscopic data and computational results for five-coordinate model 2. Experimental data are shown for the solid-state mull. The solution spectrum is not shown, as solvent binds at low temperatures (<150 K) to yield a six-coordinate species and high-temperature spectra are dominated by the high-spin form of 2. Fits to the data (red dashed lines) were performed as described in the text; each of the Gaussian fit peaks is shown (black dashes) and labeled to correspond with Table 2. The experimental MCD data are combined from independent near-IR and UV/vis experiments (grey dashed line indicates cutoff between the two spectra). For the ROHF–CISD and DFT calculations, ligand-field states are shown in black, and charge-transfer states are shown in red. Transition intensities have not been explicitly calculated from DFT calculations. Details of the computational methods are given in the Supporting Information (S3). Expanded-scale inset shows the lowest-energy ligand-field excited states in the 5000–10000 cm−1 region in MCD.