
Figure 4.
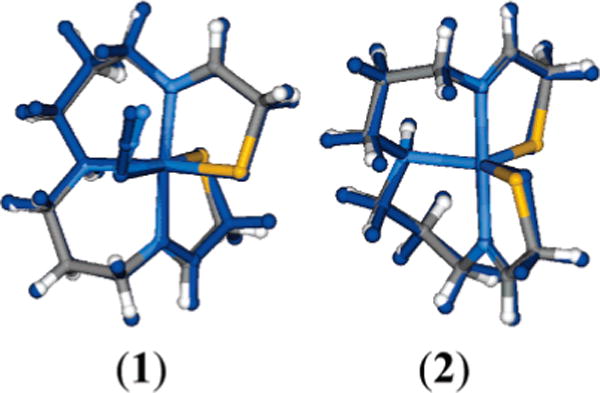
Comparison of the crystallographically defined and DFT-optimized (dark blue) geometries of complexes 1 and 2. See text for details.
Official websites use .gov
A
.gov website belongs to an official
government organization in the United States.
Secure .gov websites use HTTPS
A lock (
) or https:// means you've safely
connected to the .gov website. Share sensitive
information only on official, secure websites.
Comparison of the crystallographically defined and DFT-optimized (dark blue) geometries of complexes 1 and 2. See text for details.