
Figure 5.
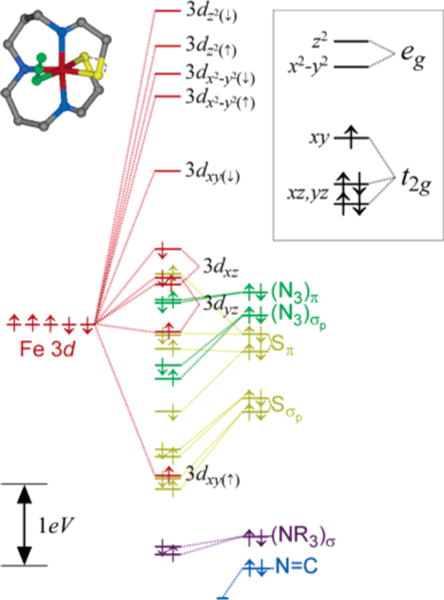
Unrestricted DFT-BP86 ground-state orbital description of 1 using crystallographic coordinates. Results are extremely similar when using the DFT optimized coordinates (given in the Supporting Information). The complete orbital splitting diagram is color-coded according to the major atomic contributors for each of the molecular orbitals. The 3d orbital splitting pattern given in the inset identifies the restricted open-shell picture that best represents the calculated electronic structure (not to scale). See text for details.