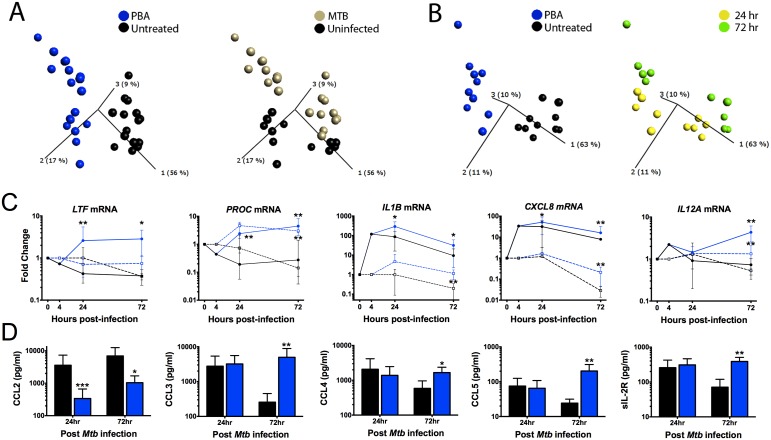
Fig 3. PBA modulates gene transcription by macrophages, irrespective of Mtb infection.
(A) Principal component anlaysis (PCA) of the 12 genes significantly regulated by PBA, irrespective of time and infection status. Each point represents one donor and condition, and its position in the plot is determined by the combined effects of all 12 genes for that treatment, time and infection type. The distance between points represents Euclidean distance. The first 3 component vectors are displayed, along with a % figure signifying the proportion of the variability in the data that each component accounts for. Points are coloured according to treatment type (left) or infection status (right). (B) PCA analysis of Mtb-infected cells coloured by treatment (left) or time of sampling (right). (C) Pattern of gene expression of 5 genes regualted by PBA (blue) vs control (black) in MTb-infected (circles, solid-lines) and uninfected MDM (squares, dashed-lines). (D) Protein secretion by MDM 72hr post-Mtb infection. Mean ± SD, n = 4–5; P-values from t-test for GLM, with adjustment for donor variation (Table 1); *, P<0.05; **, P<0.01.

