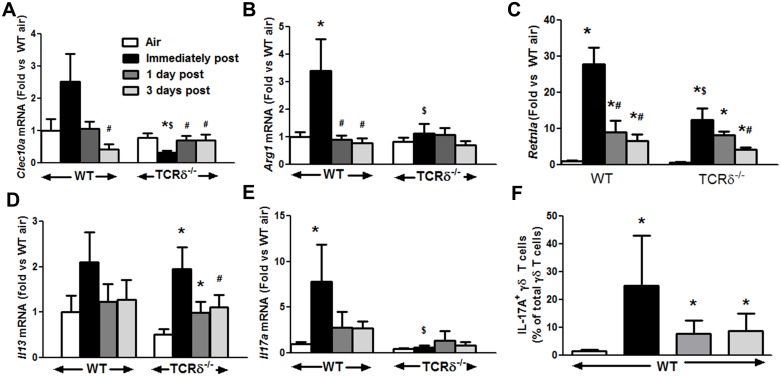
Fig 2. Pulmonary M2 gene expression after cessation of O3 exposure.
Pulmonary (A) Clec10a, (B) Arg1, (C) Retnla, (D) Il13, and (E) Il17a mRNA abundance in WT and TCRδ-/- mice exposed to room air or to ozone (O3, 0.3 ppm for 72 h) and then euthanized either immediately or 1 or 3 days after cessation of O3 exposure. (F) IL-17A+γδ were determined by flow cytometry. Note that data from the air and immediately post mice have been previously published [28] Results are mean ± SE of 4–8 air exposed mice and 6–14 O3 exposed mice in each group. * p<0.05 versus air; # p<0.05 versus 72 hour O3; $ p<0.05 versus WT mice.

