
Fig 1. Comparison of CRISPR counts and pathogenic categories.
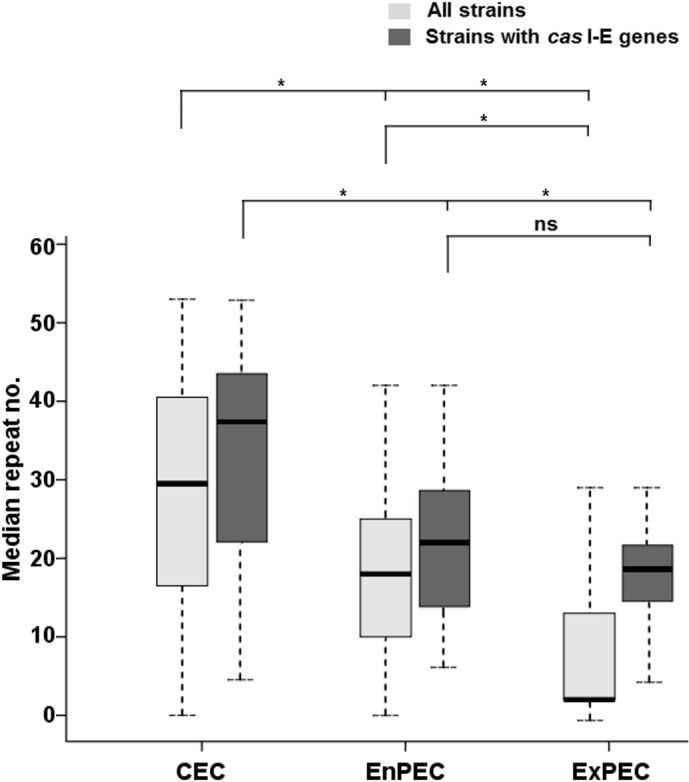
Median numbers of CRISPR2 units in commensal (CEC), enteric (EnPEC) or extraintestinal (ExPEC) pathogens of the E. coli and related strains analyzed in this study, are indicated by a horizontal line. Light grey boxes represent the interquartile range values for the whole set of 126 strains (with 28, 50 and 43 isolates for each group, respectively). Dark grey boxes comprise the interquartile range values for the reduced subset of 71 strains with intact cas I-E genes (22, 35 and 11 isolates). Vertical lines for each box denote the corresponding CRISPR2 count range. Significant differences of median values (Kruskal-Wallis p-values lower than 0.05) for the comparisons within each of these two sets of strains are indicated by an asterisk (ns, not significant).