
Fig 3. Comparison of the CRISPR counts and the number of UPEC genes.
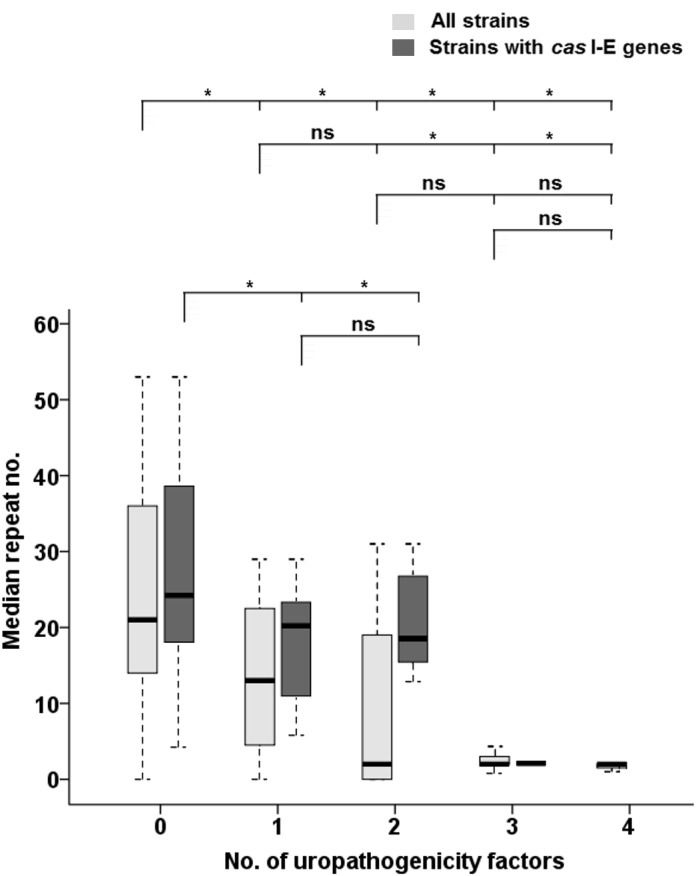
Median numbers of CRISPR2 units in the strains under study, referred to the number of selected uropathogenicity genes within those strains. For each UPEC number category (x-axis), light grey boxes represent the interquartile range for the median value (horizontal line) of all strains (N = 126, with 63, 23, 22, 7 and 11 isolates for each category, respectively), while dark grey boxes indicate that value for strains with complete cas I-E genes (N = 71 and 49, 12, 9, 1 and 0 isolates, respectively). Vertical lines indicate the CRISPR2 count ranges. Significant differences of median values (Kruskal-Wallis p-values lower than 0.05) for the comparisons within each set of strains are indicated by an asterisk (ns, not significant). The categories compared are indicated in brackets, while categories with an insufficient number of isolates are not considered for comparison (see Materials and Methods).