
Fig 4. Correlation of CRISPR counts and the number of UPEC genes.
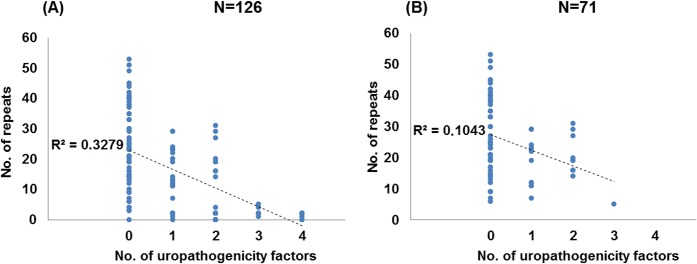
Graphical representation of the number of CRISPR repeats for strains harboring 0, 1, 2, 3 or 4 UPEC factors for the whole set of N = 126 strains (A) or the 71 strains with the intact set of cas I-E genes (B). Dotted lines represent the least-square linear regressions, and their corresponding R2 values are indicated.